Digital Workforce
A year in numbers, when looking at the digital workforce in the APS
-
Current workforce headcount
-
Amount of workforce ACT based
-
Aged breakdown of the workforce
-
Diversity profile of the workforce
-
Education profile of the workforce
-
Attitude of APS in the workforce
-
Composition of the workforce in the APS
-
Current capability outlook
-
Sources
Distribution and location
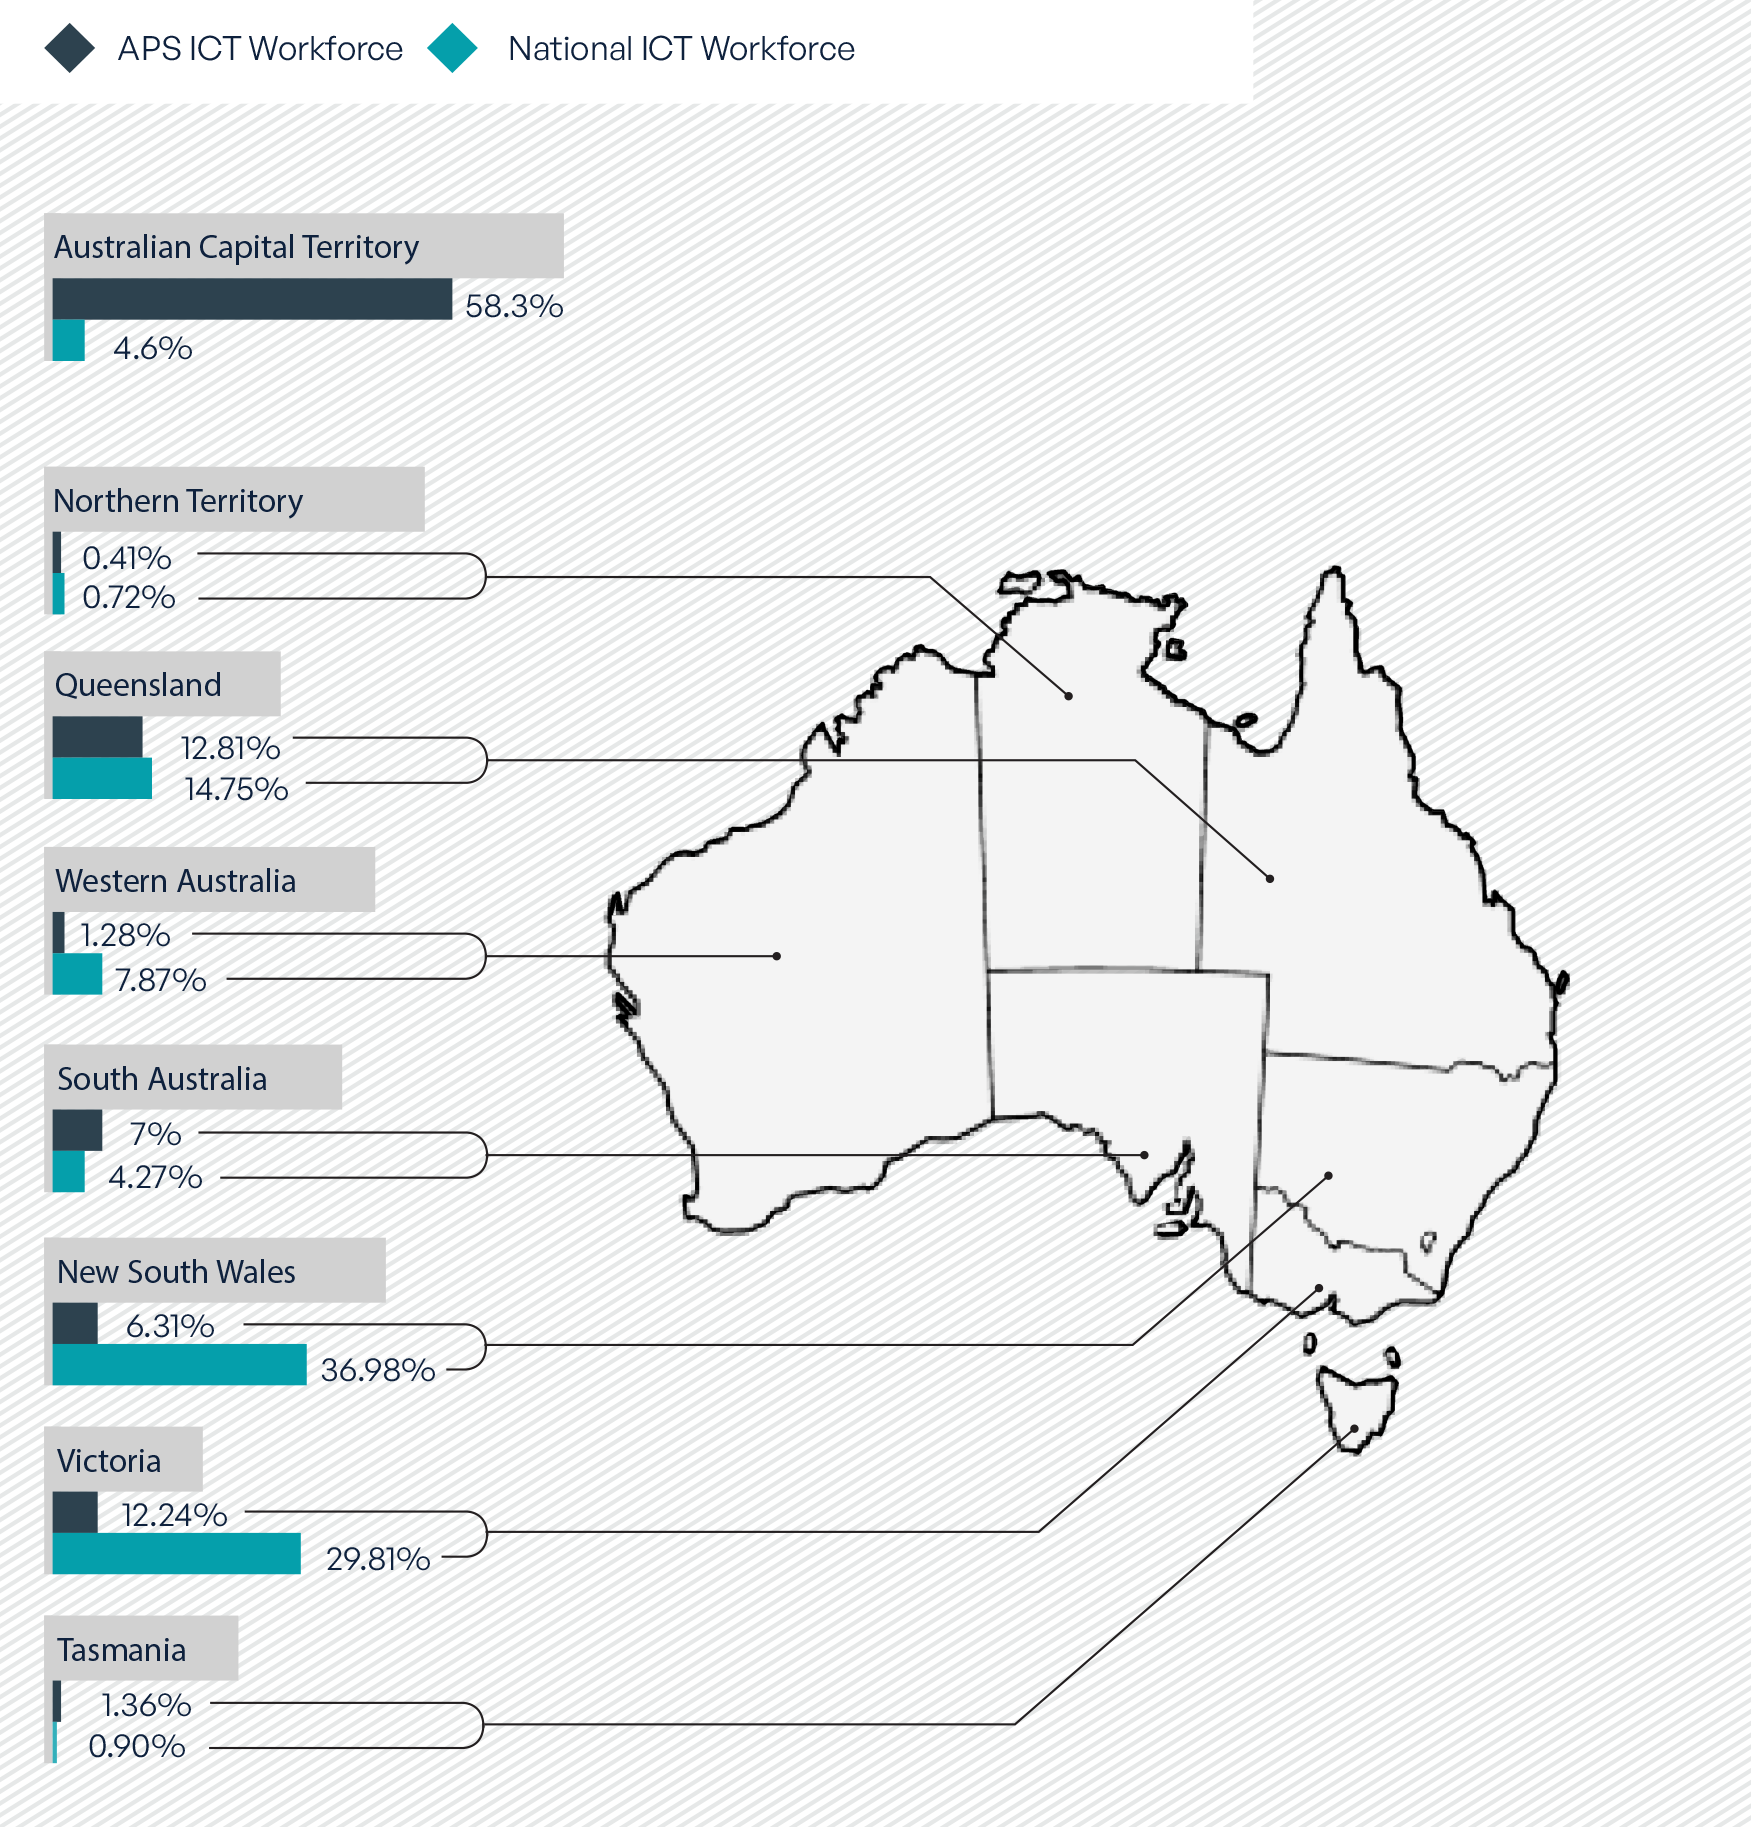
Geographic Distribution
Although 58.3% of the APS digital workforce is situated in the ACT, this is drawing from 4.6% of the national ICT workforce.
A shift to regional working is having a high impact on the distribution of the technology workforce, with 14% regional national growth in 2024.
At the current pace, it will take 132 years to balance the APS workforce between the ACT and the rest of Australia.1
Skills aren't limited to Canberra - yet ACT centricity persists
-
Figure 1: Data table
| Gold Coast | 19,387 tech workers 8% growth |
| Sunshine Coast | 9,947 tech workers 10% growth |
| Geelong | 7,076 tech workers 6% growth |
| Bendigo | 4,250 tech workers 8% growth |
| Launceston | 2,215 tech workers 8% growth |
| South East VIC | 2,119 tech workers 8% growth |
| North West VIC | 1,935 tech workers 9% growth |
- Digital Transformation Agency, APSED custom request RFI 2086 projection analysis, June 2024